I have started to run a bit about two month ago and a I was told the good way to track your fitness level and to train is to monitor your heart rate and to run according to heart rate zones. So I did some “research” and bought fitness tracker from Samsung. In order to set-up heart rate zones you need to know your resting heart rate and your max heart rate. The latter is (as the name suggests) the maximum possible heart rate of you heart. You can google on your own many examples of how to find out your value. Basically all of them are about to put your body into high stress (like hill running) and then check the maximum recorded value.
I´ll try to explore the resting heart rate from my fitness tracker data. Resting heart rate is described usually as the heart rate right after you wake up in the morning. Not quite exact description, but let´s check what we can get from raw data.
Load data
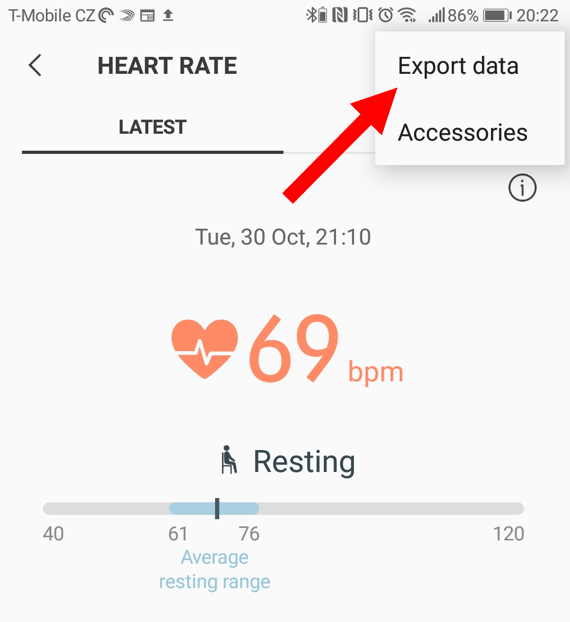
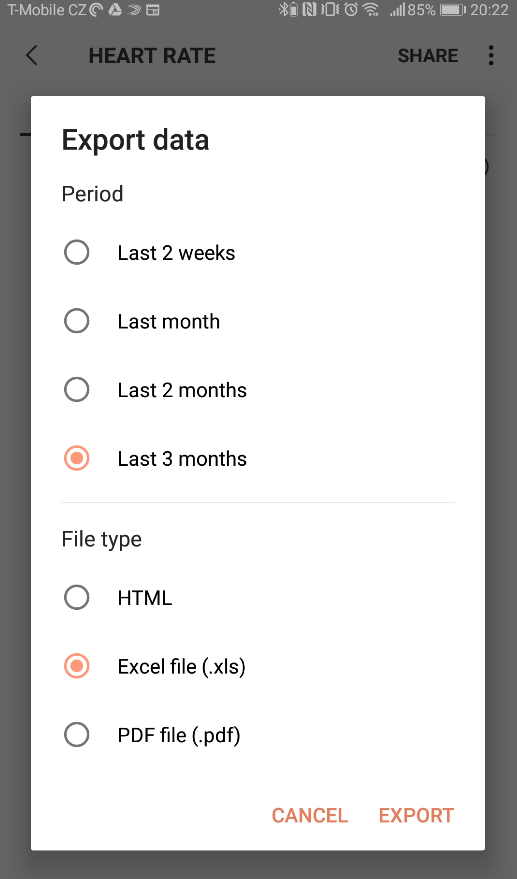
There is potentially cool function in Samsung´s health app to view trends of your heart rate, however not as useuful as one would expect - we will explore it later. The good news is Samsung allows to export the data right from the app´s options (unfortunately only last three months). Not great, but better than nothing. Let´s explore them:)
library(tidyverse)
library(lubridate)
library(readxl)
df_raw <- read_excel("../../static/data/heart_rate.xls", skip = 8)
df_raw %>% glimpse()## Observations: 1,211
## Variables: 5
## $ Date <chr> "30 Oct", "30 Oct", "30 Oct", "30 Oct", "30...
## $ Time <chr> "21:10", "20:50", "20:40", "20:30", "20:20"...
## $ `Heart rate (bpm)` <chr> "69", "73", "69", "69", "69", "76", "91", "...
## $ Tag <chr> "Resting", "Resting", "Resting", "General",...
## $ Notes <lgl> NA, NA, NA, NA, NA, NA, NA, NA, NA, NA, NA,...I can use lubridate package and create one variable DateTime from Date and Time. It will make life easier for extracting minutes and hours later on.
df_clean <- df_raw %>%
  mutate(DateTime = ydm_hm(paste("2018", Date, Time))) %>%
  rename(HeartRate = `Heart rate (bpm)`) %>%
  select(DateTime, HeartRate, Tag, -Date, -Time, -Notes) %>%
  mutate(HeartRate = HeartRate %>% as.numeric())
head(df_clean)
## # A tibble: 6 x 3
## DateTime HeartRate Tag
## <dttm> <dbl> <chr>
## 1 2018-10-30 21:10:00 69 Resting
## 2 2018-10-30 20:50:00 73 Resting
## 3 2018-10-30 20:40:00 69 Resting
## 4 2018-10-30 20:30:00 69 General
## 5 2018-10-30 20:20:00 69 Resting
## 6 2018-10-30 19:50:00 76 RestingHow many samples is available per “Tag”?
df_clean %>%
  count(Tag, sort = TRUE)
## # A tibble: 6 x 2
## Tag n
## <chr> <int>
## 1 Resting 752
## 2 General 452
## 3 <NA> 3
## 4 Exercising 2
## 5 After exercise 1
## 6 Tired 1Well, this tells me something. First of all Samsung do not provide the raw data recorded during excerices (Excersising tag). Just two values? Really? After several running and swimming workouts it is strange. It raises a question why there is such tag? Secondly, Resting and General tags seems to be worth to check. What does the “general” actually mean?
df_clean %>%
  filter(Tag %in% c("General", "Resting")) %>%
  ggplot(aes(DateTime, HeartRate)) +
  geom_point() +
  geom_smooth() +
  labs(y = "heart rate [bpm]", x = "date") +
  facet_wrap(~Tag, labeller = label_both)
## `geom_smooth()` using method = 'loess' and formula 'y ~ x'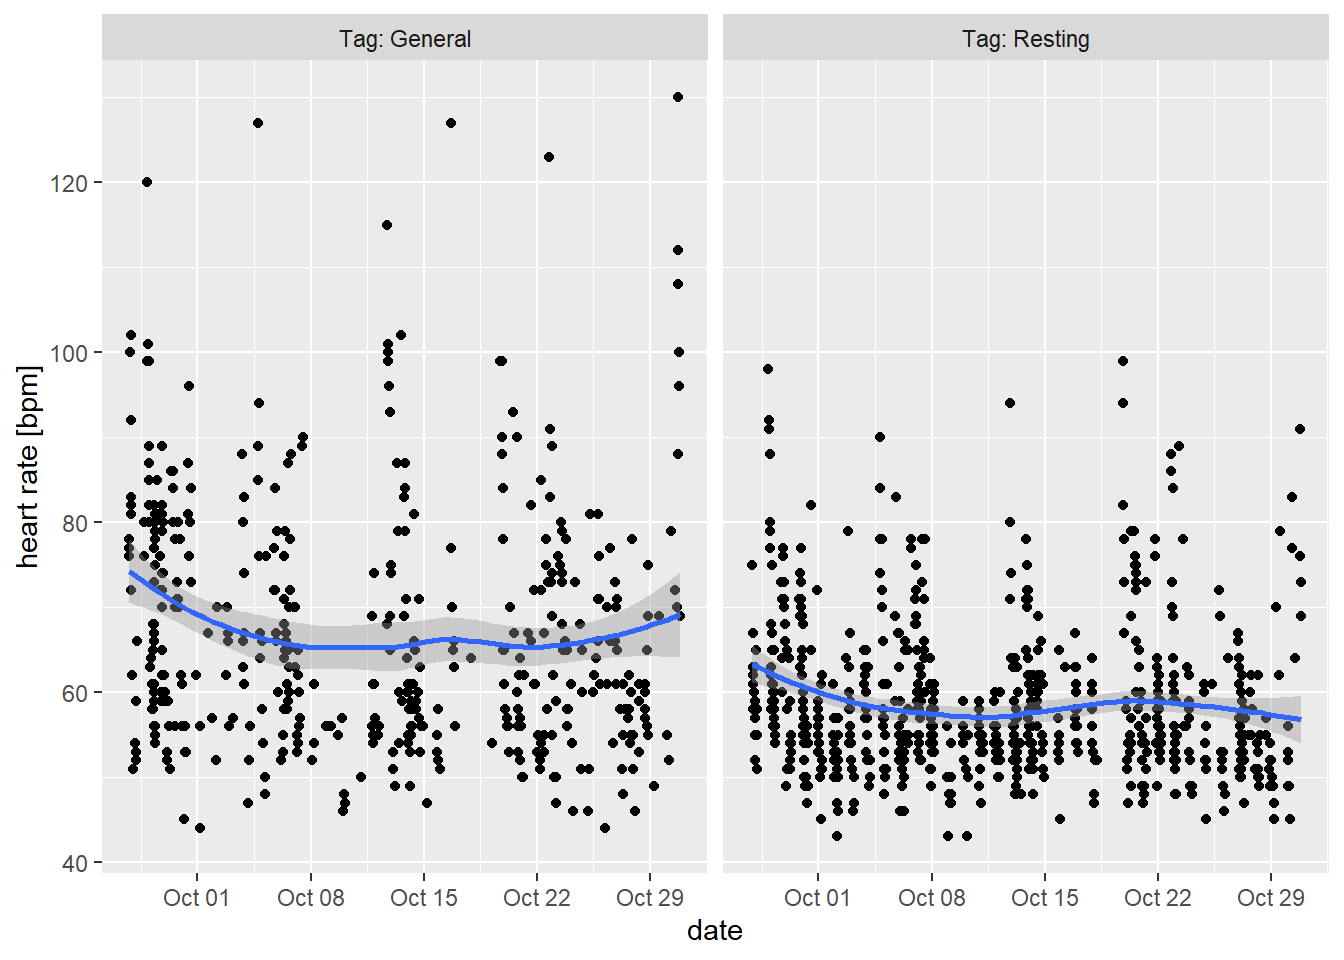
Interesting what Samsung consider as “Resting” :) I´m either having some problem with my heart or the app misclassify the measurements. The latter seems to be more likely as I wouldn´t feel much resting with heart beats over 80:). Or perhaps those are some measurement after workout. Let´s check how looks the distribution per hour.
df_clean %>%
  filter(Tag %in% c("Resting", "General")) %>%
  mutate(hour = hour(DateTime),
         minute = minute(DateTime)) %>%
  count(Tag, hour) %>%
  ggplot(aes(hour,n)) +
  geom_col() +
  scale_x_continuous(breaks = scales::pretty_breaks(n = 10)) +
  labs(y = "number of measurements", x = "hour") +
  facet_wrap(~Tag, labeller = label_both)
Most of the Resting tags comes from sleeping time ~(22:00 - 06:00) and it quite fits. The General tag is somehow not clear to me - I don´t understand why there isn´t less measurements in night time. I mean, when I´m sleeping, I´m resting, right?:)
What is the proportion of General and Resting during my usual sleeping hours?
df_clean %>%
  mutate(hour = hour(DateTime),
         minute = minute(DateTime)) %>%
  filter(hour %in% c(23, 0:5)) %>%
  count(Tag)
## # A tibble: 2 x 2
## Tag n
## <chr> <int>
## 1 General 120
## 2 Resting 429Ok, here I would expect something close to zero for General tag. In my case ~28% is misclassified as General instead of correct Resting.
So what is my resting heart rate?
It seems we can´t trust to app´s internal tagging. But we can trust our own code:). Let´s forget about internal tagging logic and simply filter sleeping hours and working days only out of all data - this should be the window when I´m definately sleeping. Furthermore just the wake-up time and calculate the value out of it.
df_clean %>%
  mutate(hour = hour(DateTime),
         minute = minute(DateTime),
         wday = wday(DateTime, label = TRUE)) %>%
  filter(!(wday %in% c("Sat", "Sun"))) %>%
  filter(hour %in% c(0:5)) %>%
  ggplot(aes(DateTime, HeartRate)) +
  geom_point() +
  geom_smooth(method = "lm") +
  labs(y = "number of measurements", x = "date", title = "Heart rate during sleep") +
  scale_y_continuous(breaks = scales::pretty_breaks(n = 10))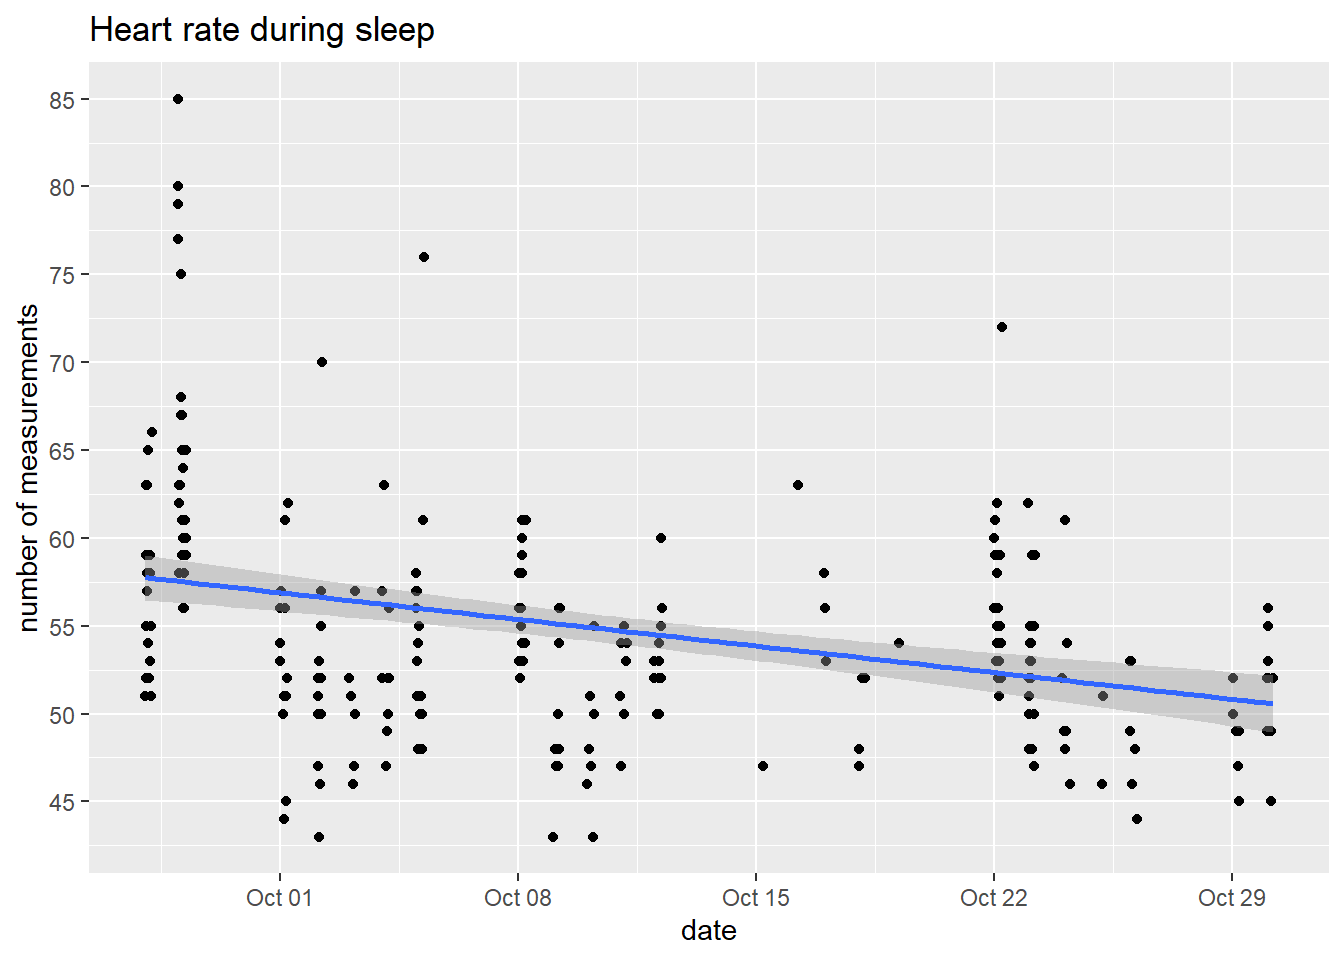
Cool, it seems that running really have some effect on resting heart rate. In this case it is more “sleeping heart rate”. We can see some decreasing trend from ~60 to ~50 bpm over one month.
So where is the single value?
df_clean %>%
  mutate(hour = hour(DateTime),
         minute = minute(DateTime),
         wday = wday(DateTime, label = TRUE)) %>%
  filter(!(wday %in% c("Sat", "Sun"))) %>%
  filter(hour == 5) %>%
  filter(minute > 20 & minute < 40) %>%
  .$HeartRate %>%
  mean
## [1] 59.8Considering my usual wake-up time window my resting heart rate is ~60bmp.
The message for me is not to take the internal tagging logic of Samsung´s app seriously.